InfluxDB as a metrics solution
We have updated this text for you!
Update date: 30.12.2024
Author of the update: Maciej Jankosz
There are plenty of tools for metrics storage and analysis. Today I’d like to present to [InfluxDB](https://www.influxdata.com/) – a solution that was used for a company I used to work for. But in November 2020, InfluxDB version 2.0 was released, I will also share my experience with Influx 1.0 in the newest version. So, let’s start with the basics.
InfluxDB
What is InfluxDB? It’s just a time-series non-relational db. The structure of its records is pretty simple:
[meassurement],[tags][fields][timestamp]
weather,location=us-midwest temperature=82 1465839830100400200
A quick explanation:
- measurement – an InfluxDB representation of a table
- tags – the value that we will use in our filters
- fields – values that we will use as our data points in graphs, statistics, etc.
- timestamp – since InfluxDB is a time-series db, timestamp is a must
Populating database
Originally, the best way to insert records into our db was via Telegraf – simple app with very powerful configuration, that pushed data into influx from many various sources (for example, files from disc, or data from Kafka). Since version 2.0 we have another great option. But first things first.
Telegraf
As I’ve mentioned, thanks to its flexible configuration, we can define many sources of our data. Let’s take a look a part of example config:
[[outputs.kafka]]
## URLs of kafka brokers
  brokers = ["localhost:9092"]
  ## Kafka topic for producer messages
  topic = "telegraf"

  ## Optional Client id
  # client_id = "Telegraf"

  ## Set the minimal supported Kafka version.
  ## Setting this enables the use of new Kafka features and APIs.
  ## Of particular interested, lz4 compression
  ## requires at least version 0.10.0.0.
  ##   ex: version = "1.1.0"
  # version = ""

  ## Optional topic suffix configuration.
  ## If the section is omitted, no suffix is used.
  ## Following topic suffix methods are supported:
  ##   measurement - suffix equals to separator + measurement's name
  ##   tags        - suffix equals to separator + specified tags' values
  ##                 interleaved with separator

  ## Suffix equals to "_" + measurement name
  # [outputs.kafka.topic_suffix]
  #   method = "measurement"
  #   separator = "_"

  ## Suffix equals to "__" + measurement's "foo" tag value.
  ##   If there's no such a tag, suffix equals to an empty string
  # [outputs.kafka.topic_suffix]
  #   method = "tags"
  #   keys = ["foo"]
  #   separator = "__"

  ## Suffix equals to "_" + measurement's "foo" and "bar"
  ##   tag values, separated by "_". If there is no such tags,
  ##   their values treated as empty strings.
  # [outputs.kafka.topic_suffix]
  #   method = "tags"
  #   keys = ["foo", "bar"]
  #   separator = "_"

  ## Telegraf tag to use as a routing key
  ##  ie, if this tag exists, its value will be used as the routing key
  routing_tag = "host"

  ## Static routing key.
  ## Used when no routing_tag is set or as a fallback
  ## when the tag specified in routing tag is not found.
  ## If set to "random",  ## a random value will be generated for each message.
  ##   ex: routing_key = "random"
  ##       routing_key = "telegraf"
  # routing_key = ""

  ## CompressionCodec represents the various compression codecs recognized by
  ## Kafka in messages.
  ##  0 : No compression
  ##  1 : Gzip compression
  ##  2 : Snappy compression
  ##  3 : LZ4 compression
  # compression_codec = 0

  ##  RequiredAcks is used in Produce Requests to tell the broker how many
  ##  replica acknowledgements it must see before responding
  ##   0 : the producer never waits for an acknowledgement from the broker.
  ##       This option provides the lowest latency but the weakest durability
  ##       guarantees (some data will be lost when a server fails).
  ##   1 : the producer gets an acknowledgement after the leader replica has
  ##       received the data. This option provides better durability as the
  ##       client waits until the server acknowledges the request as successful
  ##       (only messages that were written to the now-dead leader but not yet
  ##       replicated will be lost).
  ##   -1: the producer gets an acknowledgement after all in-sync replicas have
  ##       received the data. This option provides the best durability, we
  ##       guarantee that no messages will be lost as long as at least one in
  ##       sync replica remains.
  # required_acks = -1

  ## The maximum number of times to retry sending a metric before failing
  ## until the next flush.
  # max_retry = 3

  ## Optional TLS Config
  # tls_ca = "/etc/telegraf/ca.pem"
  # tls_cert = "/etc/telegraf/cert.pem"
  # tls_key = "/etc/telegraf/key.pem"
  ## Use TLS but skip chain & host verification
  # insecure_skip_verify = false

  ## Optional SASL Config
  # sasl_username = "kafka"
  # sasl_password = "secret"

  ## SASL protocol version.  When connecting to Azure EventHub set to 0.
  # sasl_version = 1

  ## Data format to output.
  ## Each data format has its own unique set of configuration options, read
  ## more about them here:
  ## https://github.com/influxdata/telegraf/blob/master/docs/DATA_FORMATS_OUTPUT.md
  # data_format = "influx"
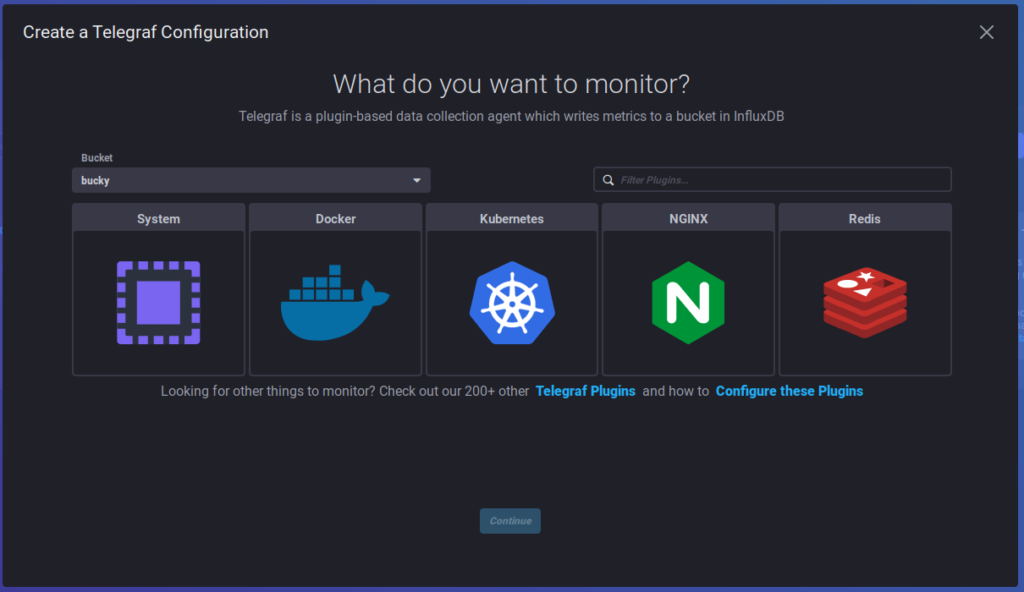
As we can see, there is plenty to configure from. We can even define additional tags. And there are a lot more plugins and configuration options! But wait, there is more! Since v2, we can configure telegraf and its plugins via GUI (which I will write about later).
Scrapers
Ok, and what about another way of populating data? 2.0 provides us with Scrapers – a tool that, every 10 sec, (by default), will pull Prometheus-format data from the given rest endpoint. And it’s configurable via GUI – a few clicks and it’s done!
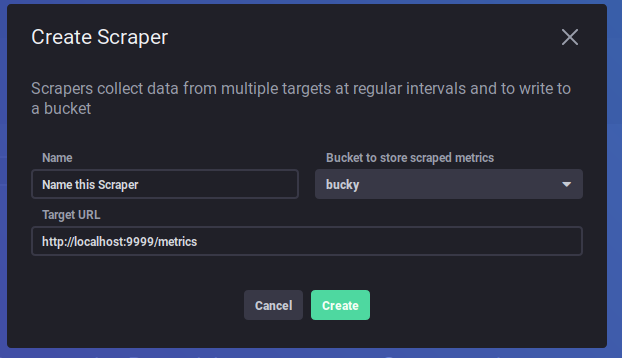
And that’s pretty much it – simple and clean.
Flux
Flux is a language designed for InfluxDB. Its structure is pretty logical for this type of db. For example:
from(bucket:"example-bucket")
  |> range(start: -15m)
  |> filter(fn: (r) =>
    r._measurement == "cpu" and
    r._field == "usage_system" and
    r.cpu == "cpu-total"
  )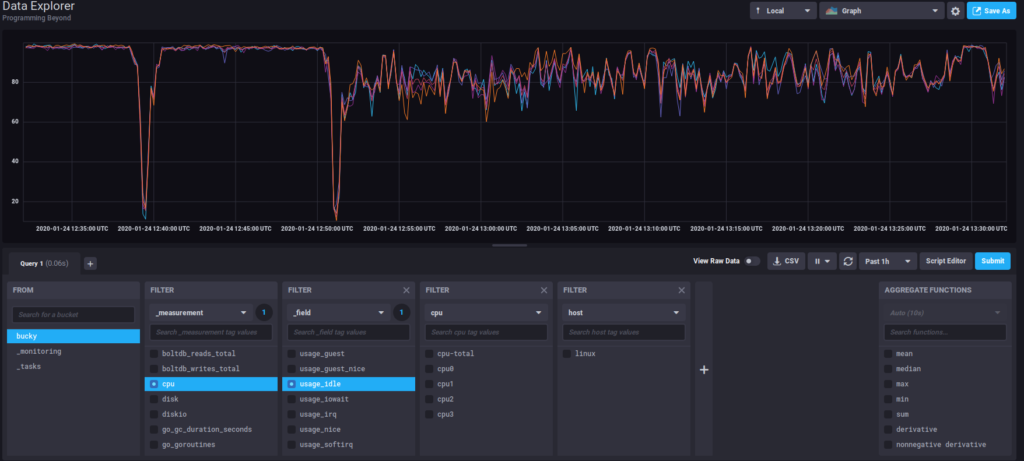
Of course, with Flux you can do much, much more. All necessary intel is inside the influx documentation flux-documentation. (in Influx v3, Flux will not be supported so this is something to keep in the back of your mind).
Kapacitor
Kapacitor is a great tool for aggregation and manipulation of collected data. Since version 2.0, Kapacitor is integrated into one package alongside with GUI and InfluxDB. Before that, it was about creating configuration files with rules for our task, and because it’s now more user-friendly, I will focus on 2.0 version of it. Let’s have an example task:
option task = {name: "test_task", every: 10m, offset: 1m}

data = from(bucket: "bucky")
    |> range(start: -task.every)
    |> filter(fn: (r) =>
        (r._measurement == "cpu" and r._field == "usage_idle"))

data
    |> aggregateWindow(every: 5m, fn: mean)
    |> to(bucket: "bucky_aggregated")
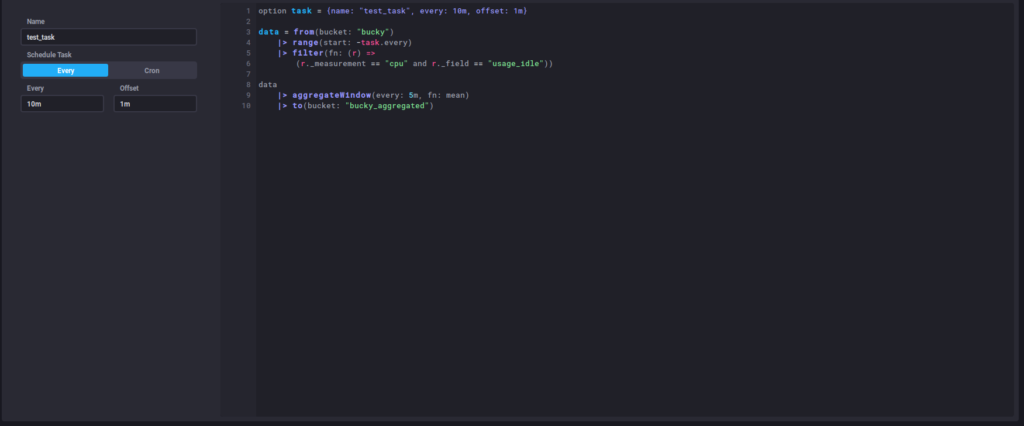
In this example, we see, that every 10m we will aggregate 5m data for cpu idle, and we will write our result in the bucky_aggregated bucket.
Let’s take a quick look at the GUI way of creating a task
Chronograf
Chronograf (integrated in v2.0) is a GUI tool for InfluxDB. It had some good points, although since InfluxDB in version 1.0 was a standalone app, we were able to easily integrate it with Grafana – a more popular tool for metric representation. But to be honest, the usage of Chronograf in 2.0 version at this point has way more sense. With possibilities of easy configuration of Telegraf, Scrapers and apacitor tasks, easy query definition and more, it’s way more efficient to stick with it. For example, here is the 2.0 front page of Chronograf
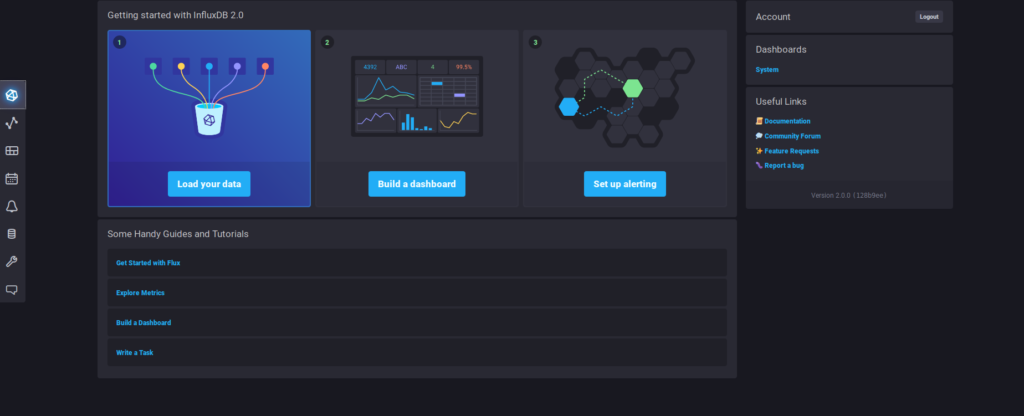
The other screenshots were also made for the 2.0 version.
OK, but what about HA?
Well, that’s the main reason I mention the InfluxDB 1.0. High availability options are implemented with the non-community version, although, for 1.0 a solution was made with influx-ha that was used for production requirements. In version 2.0, InfluxDB released a feature called Edge Data Replication. Edge Data Replication allows you to configure a bucket in an open source instance of InfluxDB to automatically replicate data from that bucket to a bucket in a Cloud instance of InfluxDB.
Conclusion
InfluxDB is definitely a solution worth a try, especially since 2.0 release has a lot of potential. It offers great performance and can manage millions of time series data points per second. It is a very solid Time Series Database and it has been proven to work in a production environment where high performance is necessary.
Peace!
Meet the geek-tastic people, and allow us to amaze you with what it's like to work with j‑labs!
Contact us


