'%3E%3Cpath fill='%233A5C8D' d='M18.08 2H1.93C.87 2 0 2.85 0 3.9v15.5l.22.02c9.75 0 17.7-7.8 17.86-17.42Z' /%3E%3Cpath fill='%233A5C8D' d='M26.33 2H24.2C24.05 14.97 13.35 25.48.22 25.48L0 25.47v2.61C0 29.14.87 30 1.93 30h24.4c1.06 0 1.94-.86 1.94-1.92V3.91c0-1.05-.88-1.9-1.94-1.9Z' /%3E%3Cpath fill='%23262C49' d='M39.27 31.8c-.74-.2-1.28-.74-1.28-1.48 0-.88.67-1.55 1.56-1.55.23 0 .37.03.64.03 1.7 0 2.92-.63 2.92-3.02V10.52c0-1.04.74-1.81 1.8-1.81 1.01 0 1.76.77 1.76 1.81v15.73c0 3.9-2.34 5.75-5.83 5.75a5.1 5.1 0 0 1-1.57-.2Zm8.01-28.87a2.34 2.34 0 0 1-2.37 2.28 2.32 2.32 0 0 1-2.38-2.28 2.31 2.31 0 0 1 2.38-2.3 2.35 2.35 0 0 1 2.37 2.3Zm9.26 14.31a2.62 2.62 0 0 1-2.66 2.57 2.6 2.6 0 0 1-2.67-2.57 2.6 2.6 0 0 1 2.67-2.56 2.63 2.63 0 0 1 2.66 2.56Zm4.56 6.89V1.81C61.1.77 61.84 0 62.9 0c1.01 0 1.76.77 1.76 1.81v22.32c0 1.05-.75 1.82-1.76 1.82-1.02 0-1.8-.77-1.8-1.82Zm21.93-8.53v8.57a1.7 1.7 0 0 1-1.76 1.78 1.73 1.73 0 0 1-1.76-1.78v-.2a6.88 6.88 0 0 1-5.13 1.98c-3.46 0-5.8-1.92-5.8-4.77 0-2.9 2.37-4.7 6.14-4.7h4.72v-1.09c0-2.25-1.3-3.52-3.57-3.52-1.39 0-2.64.5-3.69 1.54-.44.37-.82.54-1.23.54-.84 0-1.55-.7-1.55-1.48 0-.5.23-.97.7-1.44a8.39 8.39 0 0 1 6.08-2.32c4.31 0 6.85 2.55 6.85 6.89Zm-3.6 3.73v-.3h-4.27c-1.93 0-2.95.7-2.95 2.01 0 1.35 1.15 2.19 2.92 2.19 2.4 0 4.3-1.72 4.3-3.9Zm25.67-1.99c0 4.98-3.46 8.61-8.14 8.61-2.38 0-4.38-.9-5.64-2.42v.6c0 1.08-.74 1.82-1.72 1.82-1.06 0-1.8-.77-1.8-1.82V1.81C87.8.77 88.58 0 89.6 0c1.01 0 1.76.74 1.76 1.81v9.32a7.07 7.07 0 0 1 5.56-2.42c4.72 0 8.18 3.66 8.18 8.63Zm-3.66-.03c0-3.09-2.14-5.38-5.1-5.38-3.01 0-5.02 2.19-5.02 5.41 0 3.2 2.04 5.38 5.03 5.38 2.95 0 5.09-2.28 5.09-5.4Zm6.66 6.09c-.34-.3-.51-.67-.51-1.15 0-.84.71-1.54 1.6-1.54.37 0 .74.13 1.11.47a5.66 5.66 0 0 0 3.9 1.71c1.46 0 2.68-.6 2.68-1.85 0-1.07-.98-1.5-2.34-2.05l-1.7-.7c-2.67-1.11-4.34-2.32-4.34-4.81 0-3.06 2.58-4.77 5.88-4.77 2.13 0 4 .77 5.29 2.01.37.34.54.74.54 1.18a1.5 1.5 0 0 1-1.5 1.51c-.37 0-.67-.16-1.11-.5a5.47 5.47 0 0 0-3.3-1.14c-1.32 0-2.27.5-2.27 1.58 0 .9.68 1.34 2.2 1.95l1.6.63c3.02 1.25 4.55 2.56 4.55 4.98 0 3.32-2.85 5.04-6.17 5.04a8.25 8.25 0 0 1-6.11-2.56Z' /%3E%3C/g%3E%3Cdefs%3E%3CclipPath id='a'%3E%3Cpath fill='%23fff' d='M0 0h120.38v32H0z' /%3E%3C/clipPath%3E%3C/defs%3E%3C/svg%3E)
Bottlenecks identification with perf
This article presents how to easily profile a Linux system application with the perf tool. Additionally, you will learn how to visualize gathered data as interactive graphic.
Why should we always try to improve application performance?
An Answer to this question might seem obvious, but people tend to ignore real consequences of poorly written application in terms of performance. Especially in a business environment, wasted cycles on some common operations can cause a huge slowdown. We should always remember that hardware resources are not infinite and such mistakes always increase the cost of application running at desired efficiency. For example when it is some backend server, you would need to buy more machines or rent more resources from a cloud platform. On the other hand we have mobile and desktop apps where a weak performance lowers user experience and makes your program less competitive on the market.
How do performance issues arise?
Developers regularly add new lines of code to the project they are currently working on, but sometimes it is hard to predict how much they can impact application performance. Things like unnecessary iterations, object copies or database access can slide through review and increase the amount of time needed for requested operations. The Rule of thumb would be to measure how the new code changes impact time. This sounds rather easy when the application is tiny, or you just have to check one change. I usually compare elapsed times of a few test scenarios and add some timers if needed. If you are working on a major commercial project you probably have proper performance tests in releasing process so a brief check before pushing the change to repository should be fine. I will get back to evaluating a new code later on, but now let’s talk about a different scenario. You develop a relatively new, but already large application which maybe grew on some prototype or just adding new features had the highest priority so far and nobody cared too much about how well it performs. After some time it is pointed out that it got really slow with all those new things added and something needs to be done about that. Let’s also assume that there were no proper performance tests, or they were recently added to the project as the focus so far was on bringing new features. In a later part of this article I will try to show how to profile an old code which can have tens of modules and thousands of functions to find potential places for optimizations in Linux system applications.
Perf Linux profiler
To identify such places we will use the perf Linux profiler. To put it simply this tool allows us to periodically look up what our application is currently doing and save this result to a file. There are many options and minor tools associated with perf so I will not to delve into them and just go with simple example, to give you an idea what information you can get from such analysis. Firstly we need something to analyze, so I wrote a very simple program in C++.
void increment_to_3mln()
{
  for(auto i = 0; i < 3000000; ++i)
    ++i;
}

void increment_to_10mln()
{
  for(auto i = 0; i < 10000000; ++i)
    ++i;
}

int main()
{
  for(auto i = 0; i < 10000; ++i)
  {
    increment_to_3mln();
    increment_to_10mln();
  }
}
It only has two functions, one increments the variable to 3 million and the other to 10 million. Now let’s run perf and attach it to this program process. We can do this by calling
perf record -F 99 -g -p <pid>
This is going to record call stacks from all threads at a given sampling. Let’s go through the options I have passed to the perf record call.
- -F 99, this tells
perfto record 99 samples per second, - -g, enables call-graph (stack chain/backtrace) recording, we will talk more about this while presenting results of our analysis,
- -p \, specifies the process identifier
If the command is successful it should dump the binary perf.data file. Now the simplest way to get some human-readable data is to call perf report which gives us the following output
Samples: 4K of event 'cycles', Event count (approx.): 171643302607
Children Self Command Shared Object Symbol
+ 100.00% 0.00% perf_example.ou libc-2.17.so [.] __libc_start_main
+ 100.00% 0.00% perf_example.ou perf_example.out [.] main
+ 76.90% 76.74% perf_example.ou perf_example.out [.] increment_to_10mln
+ 23.10% 23.00% perf_example.ou perf_example.out [.] increment_to_3mln
0.26% 0.04% perf_example.ou [kernel.kallsyms] [k] apic_timer_interrupt
0.22% 0.00% perf_example.ou [kernel.kallsyms] [k] smp_apic_timer_interrupt
main function was present in 100% of samples and increment_to_10mln took a bit more than 3 times of what increment_to_3mln needed so that’s exactly what should be expected. The last two rows are some kernel events that you can filter out by adding the -e parameter with some arguments to perf record command. This way of presenting results may seem fine for such a simple program, but usually that is not the case. In order to have a better view of what our application does we are going to create a visualization of gathered data. To make it possible we added -g option to perf record command, so now we have all information about stack chain/backtraces . Now we will use an external set of Brendan D. Gregg scripts available at Flamegraph github to create an interactive graphic with all the data.
If we want to do that, we need to call
perf script > <file>
instead of perf report. This command interprets binary data from perf record and writes it to file in a readable, but in a bit different format than perf report does as it produces lines with successive call stacks and numbers of times they were registered. For next step we use stackcollapse-perf.pl script from the link given before.
./stackcollapse-perf.pl <perf_script_outfile> > <stackcollapse_outfile>
Now we grouped all similar call stacks under one record. One thing that is left to do is to generate an actual file.
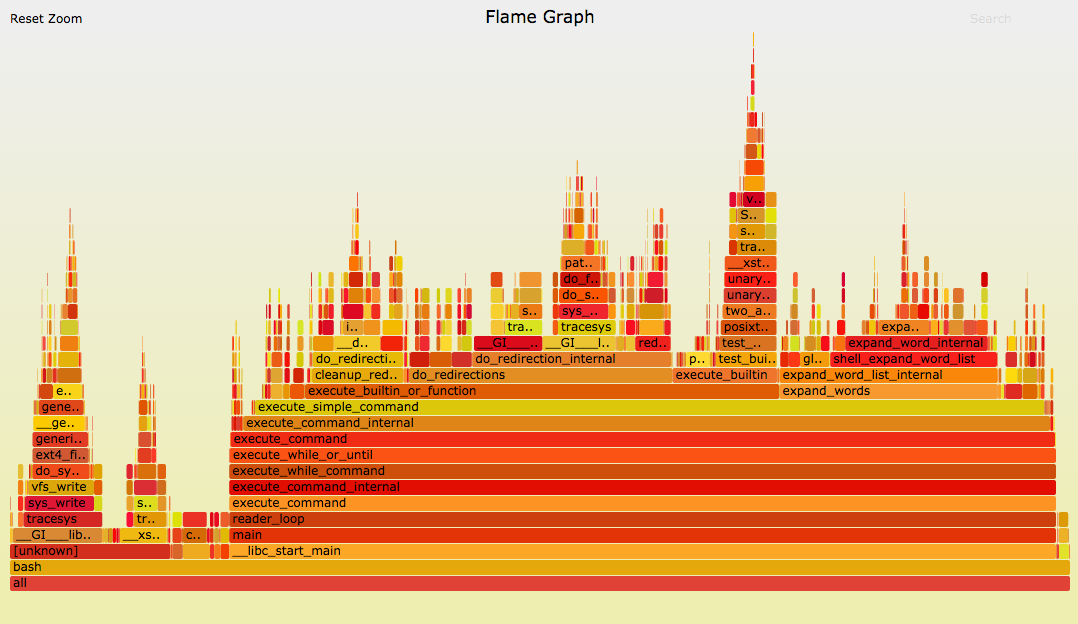
./flamegraph.pl <stackcollapse_outfile> > <png>

Link to example interactive flamegraph svg
As you can check under the link above allows you to zoom into an interesting function, and has a search tool which additionally can sum up function calls from different call paths, so you can see the total time of a chosen function execution. My example is very simple, and it might not be worth going through all the trouble to get visualization but take a look at the one from the official flamegraph site.

When you have a complex application on your hands it is a lifesaving ability to have such a clear view on where time has actually been spent. With that you can identify old performance problems easily without a the need to add your own profiling to the code. It is also a good idea to incorporate graph generation to continuous integration, with that detection of performance drops can be done by comparing current results with previous ones.
Summary
Optimizing the application is rarely easy and identifying performance issues in the code without proper profiling can consume tons of effort. Perf helps you find places with potential performance issues and takes some work off your shoulders. Identifying these places is the first step, but a crucial one. The better you know the project you are working on, the easier you can confirm what and how can it be optimized.
References
Poznaj mageek of j‑labs i daj się zadziwić, jak może wyglądać praca z j‑People!
Skontaktuj się z nami


