Testing and simulating mobile devices in Chrome DevTools
Web application testing is not only web browser compatibility testing nowadays. Verifying proper visibility on mobile devices as tablets and smartphones is same or even more important in the context of potential users.
All modern browsers provide integrated development and debugging tools for developers. Chrome browser contains a tool called Chrome DevTools which consists of many very useful features like code inspection, DOM manipulation, integrated JS console, performance and network monitoring and many more. I will introduce some really useful features related to mobile testing below.
Enabling DevTools and mobile emulation
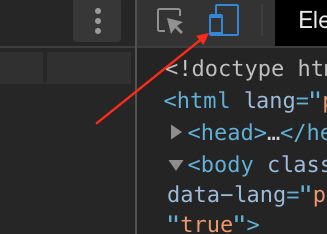
Open a site that you want to verify or debug and go to: Browser Menu > More Tools > Developer Tools (or use shortcut Cmd+Opt+I on Mac or F12 / Ctrl+Shift+I on Windows and Linux). Mobile emulation view appears after clicking on mobile device icon shown below.
Touch Enabled Emulation
In the emulation mode the standard cursor is replaced by a virtual pointer. Typical behaviour like element hover is disabled, however mobile specific actions like display tapping or scrolling are enabled.
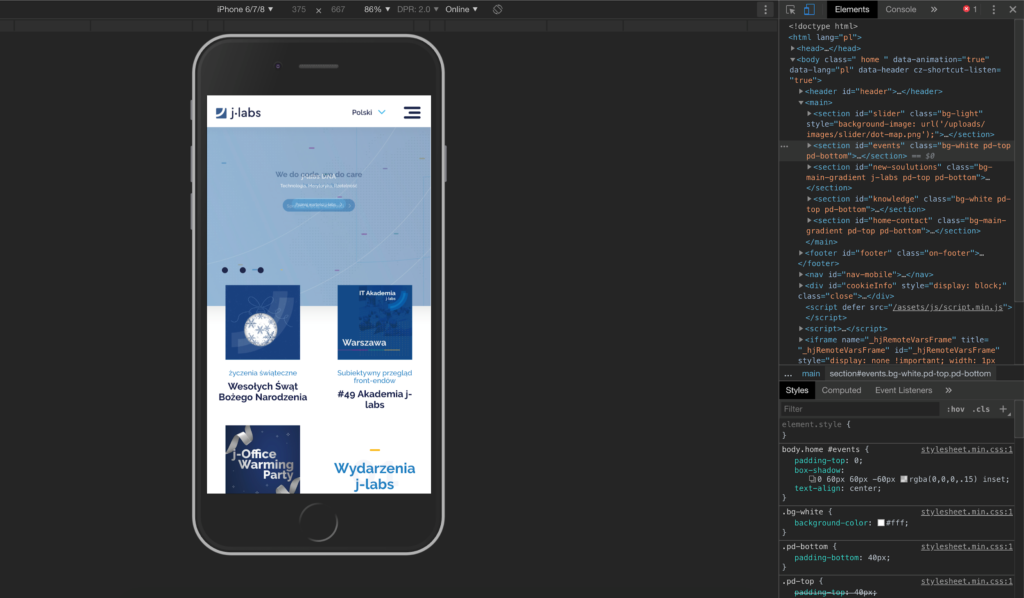
CSS Media Query Bars
Media query bar is placed below the main toolbar and presents scales for typical phones and tablets resolutions.

To enable graphical representation for current CSS file we need to open “Three dot menu” and click on “Show media query” option.

Graphical view consist of three colors:
- BLUE – queries which target a maximum width
- GREEN – queries which target widths within a range
- ORANGE – queries which target a minimum width

Emulated Devices Settings
If there is a need to add a new mobile resolution to a predefined list, we can simply do that in Developers Tool Menu (F11) > Devices tab. On this tab we can enable/disable existing devices or add a new one.
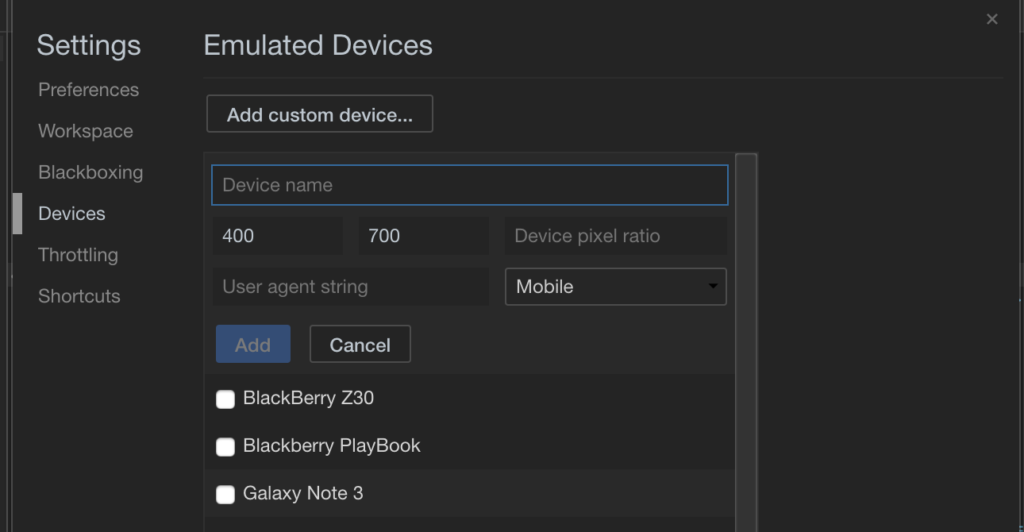
Options available for defining a new device:
- device name
- device type (tablet, mobile, etc)
- device resolution
- browser user agent name
- pixel ratio (density which is used in retina display or similar high resolution displays)
Bandwidth Throttling Simulation
This feature is very useful when we want to simulate slow network connection for example open hot spots (airports, hotels). We can check if our application works sufficient, loads quickly and remains responsive in all environments.
Throttling settings are accessible in Developers Tool Menu (F11) > Throttling tab. Here we can find predefined profiles or add a new one.
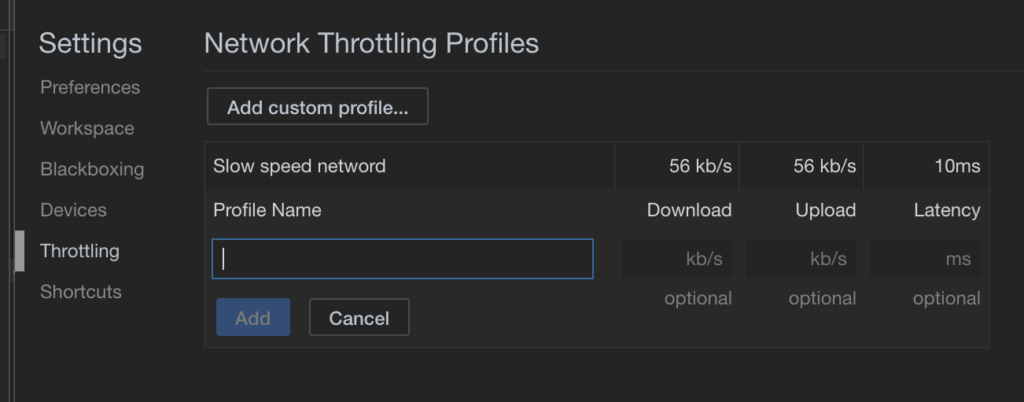
Throttling profile consist of:
- profile name
- download speed (kb/s)
- upload speed (kb/s)
- latency value (ms)
Emulated Mobile Sensors
DevTools supports also such mobile specific features as geolocation and gyroscope. These settings are accessible in More Tools Menu > Sensors.
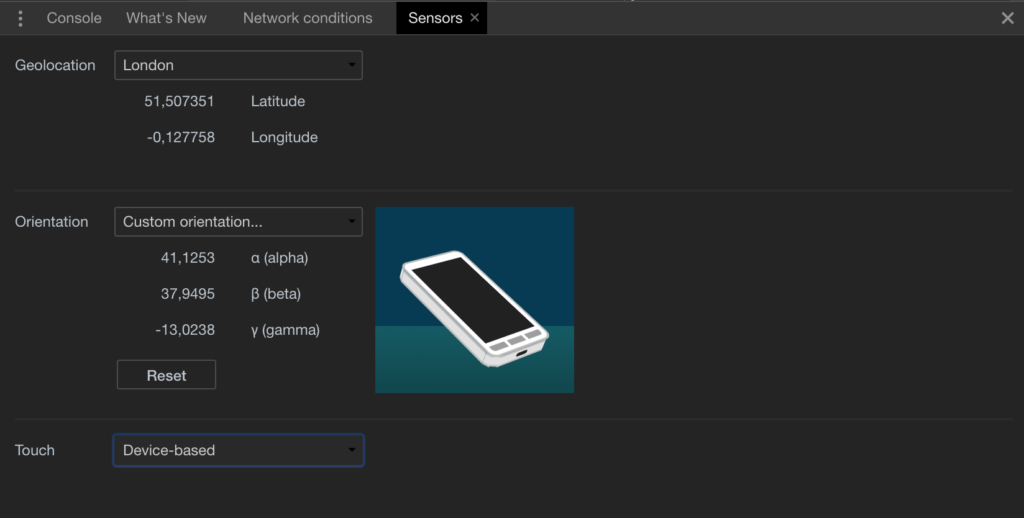
Options available to set in this feature:
- latitude and longitude – these values can be set manually, checked from predefined list or set as unavailable to emulate that the device can’t obtain GPS signal
- device orientation – we can manually set x,y,z coordinates or click and drag device image to set required position.
Chrome DevTools is a very powerful tool which contains many features that we can use in application development and testing. Since the moment I discovered it, I can’t imagine working without it. I encourage everyone to get familiar with the official documentation which you can find under this link and check what else DevTools can offer you.
Poznaj mageek of j‑labs i daj się zadziwić, jak może wyglądać praca z j‑People!
Skontaktuj się z nami


